Fix 502 Bad Gateway Without Guesswork
Fix 502 Bad Gateway errors by locating the failed proxy-to-upstream phase, reading the right logs, testing safely, and keeping a rollback path.

VPS reliability, backups, and security basics
He explains VPS reliability, security basics, backup discipline, and provider trade-offs for cautious builders.
A 502 Bad Gateway response means a gateway or proxy could not obtain a valid response from the server behind it. Visitors should retry briefly and report the failing URL and time. Operators should identify the responding layer, preserve one request trace, then fix the first failed upstream phase.
A 502 is not a diagnosis. It is a boundary marker: one server tried to act on behalf of another, and that exchange failed. The productive question is not how to clear the error. It is which intermediary returned it, and what happened during its upstream attempt.
Visitor or operator: choose the right lane
Visitors can test scope, not repair the origin. Wait briefly, reload once, try another network, and check whether other pages on the same site work. If the error persists, send the site owner the exact URL, timestamp with timezone, and any request or incident identifier shown on the error page.
Do not repeatedly submit a payment, upload, or form just because the response failed. The upstream application might have completed the action before the proxy lost its response. Confirm the result through account history or the operator before trying again.
Operators should preserve evidence before restarting anything. Record the failing request, response headers, visible error-page branding, affected region, recent deployment or configuration changes, and whether the failure is constant or intermittent. A broad restart can restore service while erasing the timing and process state that explained the incident.
Use this first split:
- one visitor only suggests a client path, geography, account, or request-specific condition;
- one URL only suggests routing, application handler, payload, or upstream pool selection;
- one proxy node only suggests local configuration, resolver, network, or resource pressure;
- every request through the edge suggests an origin, edge configuration, or shared dependency problem;
- intermittent failures suggest a subset of upstreams, connection reuse, saturation, or deployment churn.
Find the server that actually returned the 502
The browser sees the final response, but several layers may have handled the request: CDN, load balancer, ingress, reverse proxy, web server, application runtime, and a downstream service. Fixing the wrong layer wastes time and can make the outage harder to read.
Start with the response owner. Inspect the response headers, error-page style, request ID, trace ID, edge location, and server timing fields your platform exposes. Compare them with access logs at the edge and reverse proxy. If the edge recorded an origin-generated 502, follow the request inward. If it generated the response itself, investigate its origin connection first.
Capture headers without downloading a large response body:
curl -sS -D - -o /dev/null https://example.com/failing-path
Do not treat a server header as perfect attribution. Proxies can remove or replace headers, and applications can emit their own 502 response. Correlate the timestamp, URL, method, request ID, status, and upstream fields instead of trusting one label.
Build one request record before changing production
A useful incident record is small enough to compare across layers. Keep one known failing request and, if possible, one nearby successful request with the same route.
Record:
- timestamp with timezone and the observation location;
- URL, method, and safe request characteristics without credentials or personal data;
- response status, response headers, and request or trace identifiers;
- proxy node, selected upstream address or socket, and upstream status;
- connection, header, response, and queue timing where available;
- application process state, resource pressure, and deployment version;
- the exact configuration or release change that preceded the failure.
Redact secrets before sharing the record. Authentication headers, cookies, query tokens, customer payloads, and internal hostnames may be sensitive. The aim is correlation, not a complete packet dump in a public support conversation.
Read the failure by connection phase
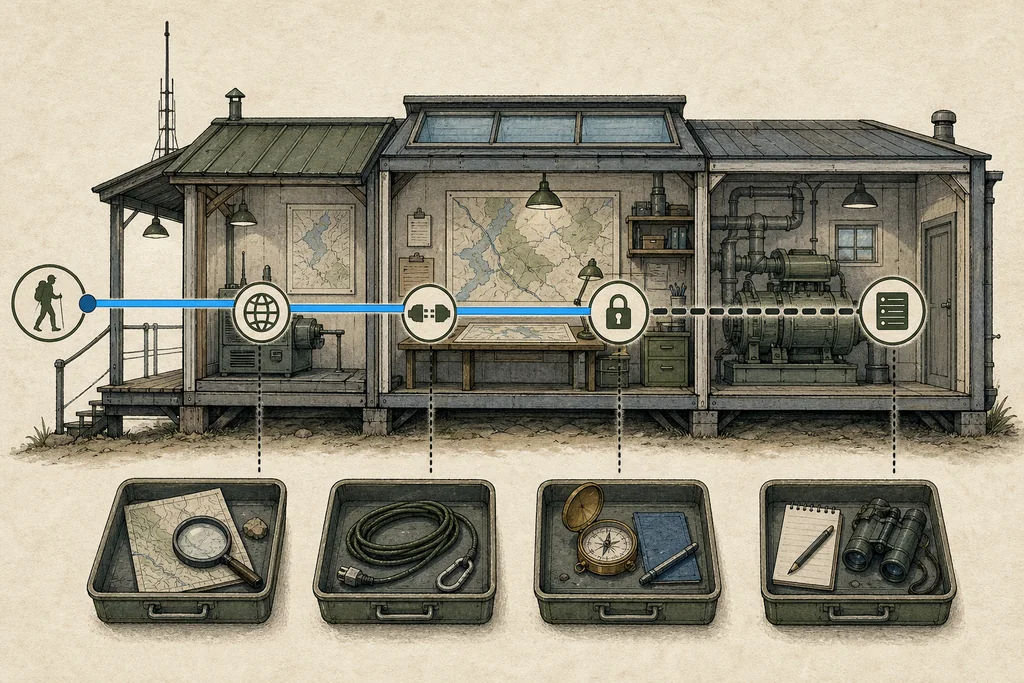
A proxy-to-upstream request has several boundaries. The first failed phase is the decision point. Error wording differs by product, so classify the meaning rather than matching one phrase blindly.
| Evidence near the 502 | Likely boundary | Check next |
|---|---|---|
| Connection refused | Nothing accepted the connection at that address and port | Confirm the target process is running, listening on the configured endpoint, and reachable from the proxy |
| Connection timed out or no route | The network path did not complete connection establishment | Check routing, security rules, address selection, target health, and saturation before changing application timeouts |
| Connection reset or premature close | The peer or an intermediary closed an active exchange | Compare keep-alive settings, application crashes, worker termination, deploy drains, and reset timing |
| TLS handshake failed | The secure upstream session was not established | Verify the origin name, certificate chain, expiry, SNI, protocol, cipher compatibility, and system time |
| Hostname could not be resolved | The proxy could not map the configured upstream name to a usable address | Query the resolver used by the proxy, check authority and delegation, and confirm how address changes are refreshed |
| UNIX socket missing or denied | The proxy could not open the local application socket | Confirm the path, process ownership, directory traversal permissions, service user, and runtime socket recreation |
| Invalid or malformed upstream response | The connection succeeded but the response could not be parsed safely | Inspect application and proxy logs for invalid headers, truncated output, protocol mismatch, or broken response framing |
| Upstream read timeout | The connection existed but the expected response data did not arrive in time | Measure application work, dependency latency, queueing, and worker availability before adjusting the limit |
Connection refused is usually precise evidence. The proxy reached a host that rejected the endpoint, or the local kernel found no listener. Check the actual address and port selected for that request. A healthy service on another port does not prove the configured upstream is healthy.
A reset is different from a refusal. A connection existed and was then closed. Look for application exits, worker recycling, deploy termination, keep-alive disagreement, or a network device sending the reset. Match the reset timestamp to process and deployment events.
A timeout describes missing progress, not insufficient patience. Determine whether the delay occurred during connection, TLS, response headers, body reads, or an application dependency. Increasing the wrong timer merely changes how long users wait for the same failure.
Test the upstream from the proxy side
Testing from a laptop proves the public path, not the proxy-to-upstream path. Run the safe equivalent from the proxy host, pod, or network namespace because DNS, routing, firewall policy, certificates, and socket access may differ there.
Check name resolution through the resolver relevant to that runtime:
dig origin.example.net A
dig origin.example.net AAAA
Check whether the upstream is listening and reachable:
curl -sS -D - -o /dev/null http://origin.example.net:8080/health
ss -lntp
When the upstream uses virtual hosting, preserve the expected host name. When it uses HTTPS, test the certificate and SNI name rather than connecting by address and declaring TLS broken.
curl -sS -D - -o /dev/null --resolve app.example.com:443:192.0.2.10 https://app.example.com/health
openssl s_client -connect 192.0.2.10:443 -servername app.example.com
Use a health endpoint that is cheap, representative, and protected appropriately. A static health response can prove that a listener exists while the real application route still fails. Compare both when the incident affects only particular requests.
Diagnose Nginx upstream failures
For Nginx, confirm that the active proxy target matches the service that should receive the request. Check the loaded configuration, not only the file you expected to be loaded. Validate before reload.
nginx -t
nginx -T
Log the upstream boundary explicitly. Useful fields include the request ID, selected upstream address, upstream status, connection time, header time, response time, queue time, total request time, and final response status. These fields separate slow connection establishment from slow application work and from failure before an upstream was selected.
The connection timer covers establishing the proxied connection. The read timer concerns gaps between successive reads from the upstream; it is not a total transaction budget. A large blanket value can hide a stalled worker pool and hold proxy connections open longer.
Check whether retry behaviour is safe for the request method. Passing a failed non-idempotent request to another upstream can repeat side effects. A retry policy is not a substitute for application idempotency.
For local runtimes such as FastCGI, confirm that the configured UNIX socket exists after service restart, that parent directories permit traversal, and that the proxy worker can open it. Socket ownership fixed by hand may be lost again when the runtime recreates the file; correct the service configuration that creates it.
Diagnose Apache reverse-proxy failures
For Apache HTTP Server, verify the active virtual host, ProxyPass destination, balancer membership, and worker parameters. Validate the complete configuration before a graceful reload.
apachectl configtest
apachectl -S
Treat ProxyTimeout as a network boundary, not a performance cure. Compare proxy errors with application duration and dependency timings first. If the application legitimately requires a longer response window, set a deliberate value for the relevant route and document the client-facing cost.
Check the Apache error log at the incident timestamp, then correlate the same request in the upstream application log. A proxy error without a matching application request points toward connection, name resolution, TLS, routing, or endpoint selection. An application request that ends abruptly points further inward.
Separate CDN or load balancer from the origin
An edge service can forward a 502 produced by the origin or generate one when it cannot connect, negotiate TLS, resolve the origin name, or parse the origin response. Use edge logs and diagnostic headers to distinguish those cases.
Do not disable the CDN or WAF as a standing fix. That can expose the origin, change caching and TLS behaviour, bypass access controls, and create a second incident. If policy allows a direct-origin comparison, restrict the test by source, preserve the correct host name and TLS name, avoid public DNS changes, and remove the exception immediately.
At the edge-to-origin boundary, verify:
- the configured origin name resolves from the edge service;
- the resolved address is current and accepts the configured port;
- the origin certificate covers the name used for TLS and supplies a valid chain;
- protocol and cipher settings overlap;
- origin access rules allow the intended edge addresses without opening the service globally;
- the origin returns a complete, valid HTTP response for the requested host.
If support escalation is needed, provide the failing URL, timestamp with timezone, request or edge identifier, region, response headers, and a statement of whether the origin succeeded when tested through an authorised path. A screenshot alone is weak evidence.
Check resource pressure without blaming load blindly
Resource exhaustion can produce a 502 indirectly when an application process dies, stops accepting connections, resets requests, or misses a response deadline. It is not enough to see high CPU and declare the case closed.
Match the resource to the failure. Check application worker saturation, listen backlog, file descriptors, memory pressure and kills, process restarts, connection pools, dependency latency, and disk availability. Compare the affected interval with proxy connection and response timing.
A process may be alive but unable to accept more work. A health check may also pass while the real route waits on a database or external API. Inspect queue depth, active workers, and dependency timing alongside machine utilisation.
If capacity is permanently tight, rent boring infrastructure with enough headroom or reduce the work on the request path. Repeatedly extending timeouts turns an overloaded upstream into a larger queue; it does not create capacity.
Change one variable and keep the rollback close
The safest repair is the smallest change that explains the evidence. State the hypothesis, change one variable, retest the same request, watch adjacent metrics, and define the rollback before applying it.
| Evidence-backed cause | Narrow fix | Roll back when |
|---|---|---|
| Wrong upstream address or port | Correct the route and validate the target from the proxy network | Errors move to a different route or health checks regress |
| Service not listening | Restore the expected process and investigate why it stopped | The process loops, resource pressure rises, or the endpoint remains inconsistent |
| Stale or broken name resolution | Correct DNS authority or resolver behaviour and verify every returned address | Resolution diverges across nodes or traffic reaches an unintended target |
| TLS name or chain mismatch | Install the correct chain or align the configured origin name and SNI | Other hosts fail validation or the edge cannot negotiate the intended policy |
| Socket path or permission mismatch | Correct the runtime-created socket path and service ownership policy | A restart recreates the mismatch or broadens access unexpectedly |
| Measured application duration exceeds a justified limit | Optimise the work or raise only the relevant route timer with a bounded value | Connection occupancy, queueing, or user latency worsens without reducing errors |
| One unhealthy upstream in a pool | Drain that target and repair it outside rotation | Healthy capacity becomes insufficient or errors persist across the remaining pool |
After the error clears, repeat the original failing request and a normal request. Confirm final status, upstream status, phase timings, application completion, and any side effect. Then remove temporary logging, access exceptions, or diagnostic routes that should not remain.
Checklist
- Capture one failing URL, timestamp, response header set, and request identifier before any restart removes the evidence.
- Identify the response owner and selected upstream so edge, proxy, and origin work are not mixed together.
- Classify the first failed phase as DNS, connection, TLS, socket, response parsing, or upstream processing before choosing a fix.
- Change one configuration or service condition, retest the same request, and watch for regression in healthy traffic.
- Keep a written rollback condition and remove temporary bypasses, access rules, and verbose logging after verification.
Common questions
FAQ
Can clearing my browser cache fix a 502 Bad Gateway error?
Is a 502 always caused by Nginx?
What is the difference between 502 and 504?
Should I increase the proxy timeout?
Should I restart Nginx, Apache, or the application?
Prepared by
VPS reliability, backups, and security basics
He explains VPS reliability, security basics, backup discipline, and provider trade-offs for cautious builders.
Verified facts
HostScout editorial