Fix Slow MySQL Queries Without Guessing
Fix slow MySQL queries with a measured workflow: find the real statement, read EXPLAIN safely, test one index or rewrite, and verify the workload.

VPS reliability, backups, and security basics
He explains VPS reliability, security basics, backup discipline, and provider trade-offs for cautious builders.
To fix a slow MySQL query, identify the exact statement and parameters, capture its workload context, inspect EXPLAIN, and run EXPLAIN ANALYZE only in a controlled environment. Change one query or index at a time, replay representative traffic, and compare latency, rows examined, locks, CPU, I/O, and write cost.
Prove the query is the slow part
A slow page does not automatically mean a slow query. The application may wait on a connection pool, lock, remote API, filesystem, overloaded worker, network path, or cache miss. Database CPU can also look calm while sessions queue behind one transaction.
Start with one request and one timeline. Record the endpoint or job, time window, tenant or account scope, result size, cache state, and the database calls inside it. Correlate application timing with MySQL evidence. If the page is slow but no statement duration moves with it, keep investigating outside the query.
Separate a query that is always inefficient from a query that becomes slow only under concurrency. The first points toward plan shape, data distribution, or returned work. The second may involve locks, resource contention, hot rows, connection pressure, or an execution plan that changes with parameters.
Capture the statement shape, not private data
The same SQL template can behave differently with selective and unselective parameters. Save a normalized statement or digest, representative parameter classes, rows returned, calling feature, and frequency. Do not paste customer values, tokens, or personal data into a ticket or shared document.
Performance Schema statement summaries can aggregate execution count, time, rows examined, rows sent, temporary-table work, scans, and index-use indicators. Availability and retention depend on server configuration, so first confirm that the relevant instrumentation is enabled and that your account can read it.
This read-only query surfaces statement shapes with high accumulated execution time in the current summary window:
SELECT DIGEST_TEXT, COUNT_STAR, SUM_TIMER_WAIT,
       SUM_ROWS_EXAMINED, SUM_ROWS_SENT
FROM performance_schema.events_statements_summary_by_digest
ORDER BY SUM_TIMER_WAIT DESC
LIMIT 10;
Total time and single-call latency answer different questions. A moderately slow query called constantly can consume more capacity than the slowest one-off report. Keep both frequency and per-call behavior visible when choosing what to fix first.
Use the slow query log as a filter
MySQL can write statements to the slow query log when they cross configured execution-time and examined-row conditions. Those controls define what this server calls slow; they are not universal recommendations for every workload.
Inspect the current state before proposing changes:
SHOW VARIABLES
WHERE Variable_name IN (
  'slow_query_log',
  'long_query_time',
  'min_examined_row_limit'
);
The slow log has boundaries. MySQL writes an entry after the statement runs and locks are released. Initial lock-acquisition time is not included in its execution time, and log order may differ from execution order. A missing entry does not prove that users experienced no database wait.
Enabling or broadening logging can create storage and observation overhead. Decide the capture window, destination, retention, access controls, and stop condition before changing server settings. On managed databases, use the provider’s documented logging control instead of assuming direct file access.
Establish a repeatable baseline
Choose the exact SELECT shape and representative parameters. Run it against a staging copy or read replica with similar schema, statistics, and enough representative data to expose the same plan. A tiny development database can make a full scan look harmless.
Record more than wall-clock time:
- rows returned and rows examined;
- plan shape and chosen indexes;
- temporary-table and sort work;
- lock wait and concurrency conditions;
- CPU, disk I/O, memory pressure, and cache state;
- execution count and application-level latency.
Warm and cold runs are different evidence. Do not average them blindly. Label whether data and indexes were already cached, whether other traffic was present, and whether the result itself was cached by the application.
Keep the original query and plan output. Without a before state, a faster second run may only prove that the first run warmed the cache.
Read EXPLAIN as a route, not a score
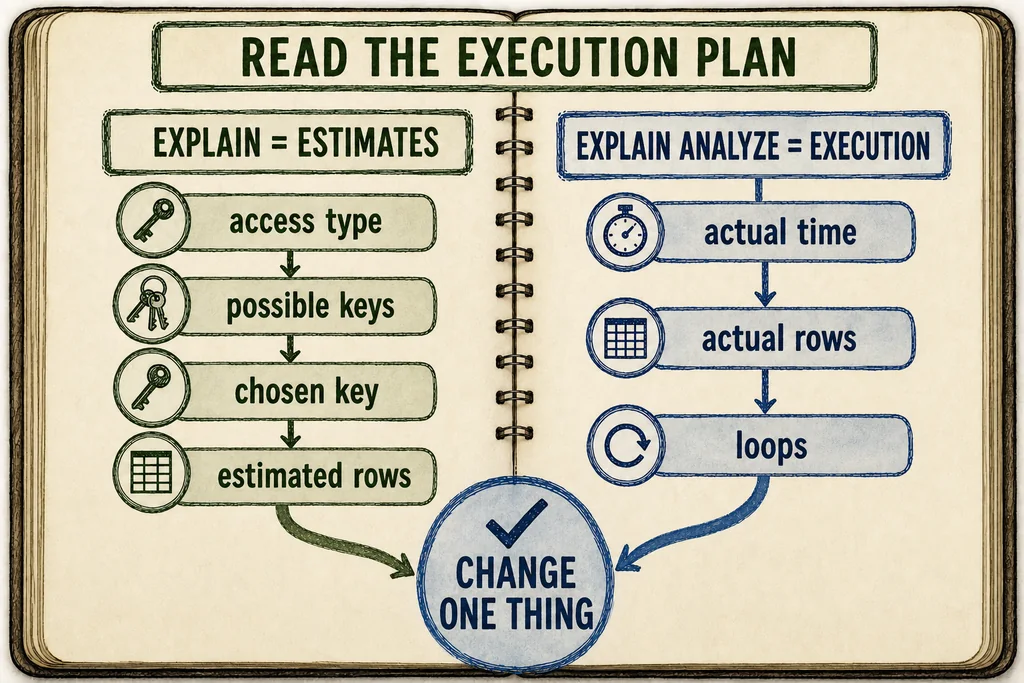
EXPLAIN shows how MySQL expects to process a statement. For each table, traditional output includes the access type, possible indexes, chosen index, estimated rows, filtering estimate, and extra plan notes.
EXPLAIN FORMAT=TREE
SELECT ...;
Replace the placeholder with the exact SELECT you are investigating. Preserve its joins, filters, ordering, grouping, and representative parameter classes. A simplified query can receive a different plan and answer the wrong question.
| Field or node | Question to ask |
|---|---|
| Access type | Is MySQL using a lookup, range, index scan, or table scan for this table? |
| Possible keys | Which indexes could the optimizer consider for this route? |
| Chosen key | Which index did it actually select, if any? |
| Estimated rows | How much work does the optimizer expect at this step? |
| Filtered | How much of the examined set is expected to survive the condition? |
| Extra or tree text | Are sorting, temporary work, covering access, or attached filters visible? |
No field is a verdict by itself. A query plan is not a horoscope. A table scan can be sensible for a small table or a query returning much of it. An index name in the plan does not prove low work. Compare the whole route with the query’s purpose and data distribution.
The plan is evidence, not a verdict: compare the proposed route with observed execution, then test one change against the same workload.
EXPLAIN ANALYZE executes the statement
EXPLAIN ANALYZE adds actual timing, returned rows, and loop counts to the optimizer’s estimates. That comparison can reveal a step where expected and observed work diverge or where a nested operation repeats more than expected.
EXPLAIN ANALYZE
SELECT ...;
This is not a harmless formatting option. MySQL runs the statement. Use a controlled SELECT on staging or another environment where load, data sensitivity, and side effects from functions are understood. Do not attach it casually to an expensive production query during an incident.
Read each iterator from its children upward. Compare estimated rows with actual rows, then look at loops and time. Large total time can come from one expensive operation or a modest operation repeated many times. Follow the observed route before reaching for a server-wide setting.
If staging cannot reproduce production data distribution, use plain EXPLAIN plus production summaries and logs. State the limitation instead of manufacturing certainty with a synthetic benchmark.
Inspect indexes before adding another one
SHOW INDEX returns the existing index names, column order, prefix information, cardinality estimate, type, and visibility.
SHOW INDEX FROM your_table;
An index must match the access pattern. For a composite index, MySQL can use leftmost prefixes for lookups. Column order therefore matters across equality filters, ranges, joins, grouping, and ordering. A pile of single-column indexes is not automatically equivalent to the composite route the query needs.
Indexes also cost storage and write work. Every relevant insert, update, or delete may need index maintenance. Review duplicate or overlapping indexes, write volume, table size, lock behavior, build method, replica impact, backup time, and rollback before approving a schema change.
Do not paste a CREATE INDEX command from an article into production. Design the candidate against the exact query set, build it through the database’s normal migration process, and test both reads and writes on representative data.
Rewrite work the query does not need
Before adding an index, ask whether the statement requests unnecessary work. Return only needed columns and rows. Check whether joins are required, whether grouping or sorting matches the product behavior, and whether the application fetches a large result only to discard most of it.
Preserve semantics first. A faster query that changes null handling, duplicate behavior, ordering, permissions, or transaction consistency is a defect. Write result-set checks for representative and edge-case inputs before comparing speed.
Look for repeated queries from the application, especially per-row lookups that could be fetched in a controlled set. Also check pagination design and report workloads. Moving work from one large query into thousands of small calls can improve one plan while making the request slower overall.
Change one thing and replay the workload
Make one candidate change: a query rewrite, a tested index, a data-access adjustment, or a narrowly justified statistics action. Keep code, schema, server configuration, and traffic shape otherwise stable.
Keep the comparison honest. Compare the same evidence after the change:
| Evidence | Improvement question | Regression question |
|---|---|---|
| Query plan | Did the expensive route change as expected? | Did another table or parameter class get a worse route? |
| Actual execution | Did time, rows, and loops improve consistently? | Is the gain only a warm-cache artifact? |
| Workload | Did total database time and request latency fall? | Did concurrency or lock waits rise? |
| Writes | Is update and insert cost still acceptable? | Did index maintenance or migration pressure increase? |
| Operations | Can the change be deployed and reversed safely? | Does it complicate replicas, backups, or recovery? |
Test the tail, not only the median. A change can make common parameters faster while rare customers, large tenants, or reports get worse. Replay representative parameter classes and observe the system under expected concurrency.
Do not hide query problems with universal server tuning
Buffer sizes, connection limits, I/O settings, and concurrency controls interact with workload, memory, storage, and other services. A value copied from another server can waste memory, trigger swapping, or move the bottleneck without fixing the query.
Tune the server only after measuring resource pressure and understanding the query workload. Document current values, expected effect, monitoring, rollback, and the combined memory commitment across connections and caches. Change one bounded setting at a time.
If the plan is reasonable but latency rises with load, inspect lock waits, disk latency, CPU saturation, connection queues, replica state, and noisy neighbors. Assume the cheap plan is crowded until measurements show otherwise; then decide whether optimization or capacity is the correct lever.
Hosting affects the diagnostic options
When comparing a VPS from DigitalOcean or Hetzner on HostScout, check the CPU model and sharing policy, storage type, I/O limits, memory, backup controls, snapshots, monitoring access, recovery console, and resize or migration path.
Rent boring infrastructure. Predictable access to metrics, backups, and recovery is more useful during a database incident than an oversized headline specification with unclear contention. Confirm what the provider measures and what remains your responsibility inside MySQL.
A larger server can reduce pressure, but it does not make an unbounded query bounded. Preserve the query-level evidence so a capacity move is evaluated against the same workload rather than celebrated after one warm page load.
Checklist
- Correlate one slow application path with exact query shapes, parameter classes, frequency, locks, and host resource evidence.
- Inspect Performance Schema summaries and the current slow-log controls without exposing private values or changing production settings blindly.
- Save the baseline, run EXPLAIN, and use EXPLAIN ANALYZE only for a controlled SELECT where executing the statement is safe.
- Inspect existing indexes and design one query or index change against the full read-and-write workload, with a deployment and rollback plan.
- Replay representative parameters and concurrency, compare plan and workload evidence, then monitor the production change and revert if regressions appear.
The fix is a smaller verified workload
A slow query is fixed when the application performs less unnecessary work, the database follows a better route, and the improvement survives representative data and concurrency. A green result from one laptop run is not enough.
Keep the investigation narrow. Save the baseline, distinguish estimates from execution, change one thing, and verify the system around it. Test the restore and rollback path before the migration window. The query plan tells a useful story only when production can safely disagree.
FAQ
Does EXPLAIN run a MySQL SELECT query?
Does every slow MySQL query need a new index?
Is a full table scan always bad?
What should I compare after optimizing a query?
Prepared by
VPS reliability, backups, and security basics
He explains VPS reliability, security basics, backup discipline, and provider trade-offs for cautious builders.
Verified facts
HostScout editorialRelated articles
Self-host n8n on a VPS: a safe setup plan
Self-host n8n on a VPS with persistent Docker storage, TLS, correct webhook URLs, credential protection, backups, and a tested update plan.
Linux swap file setup for a low-RAM VPS
Linux swap file setup for a low-RAM VPS, with practical sizing rules, OOM tradeoffs, checks, and when to upgrade RAM instead.
Machine learning server requirements
Machine learning server requirements for training and inference: compare CPU, GPU, RAM, storage, provider fit, and operational risks.
RAID levels explained for dedicated servers
RAID levels explained for server buyers: compare RAID 0, 1, 5, 6 and 10 by speed, redundancy, usable capacity and rebuild risk.
What Is an IP Address? IPv4, IPv6, Public and Private
What is an IP address? Learn how IPv4, IPv6, public, private, static, and shared addresses affect hosting, DNS, security, and server choice.
What is WordPress? .org vs .com explained
What is WordPress? Learn how WordPress.org and WordPress.com differ, what each costs, and when self-hosted WordPress is worth it.